문제 1.
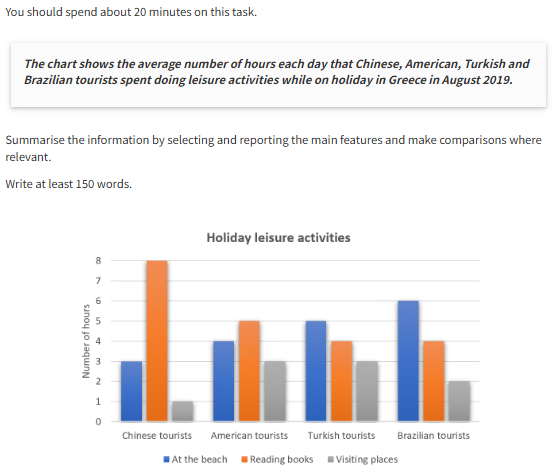
The bar chart compares ..while on holiday ..
The activities were going to the beach, ...
Overall, the tourists spent the most time reading books while they spent the least time ..
The Chinese tourists spent the longest reading books with..
By contrast, the Brazilians spent..
Both the American and the Turkish tourists spent .. with a total of three hours each.
Similarly, the Turkish and Brazilian groups spent ..
The Chinses tourists spent twice the acount of time .., whereas the American and Turkish groups spent ..
tip! 정보를 제공할 때 정확한 숫자를 적어주세요.
문제 2.
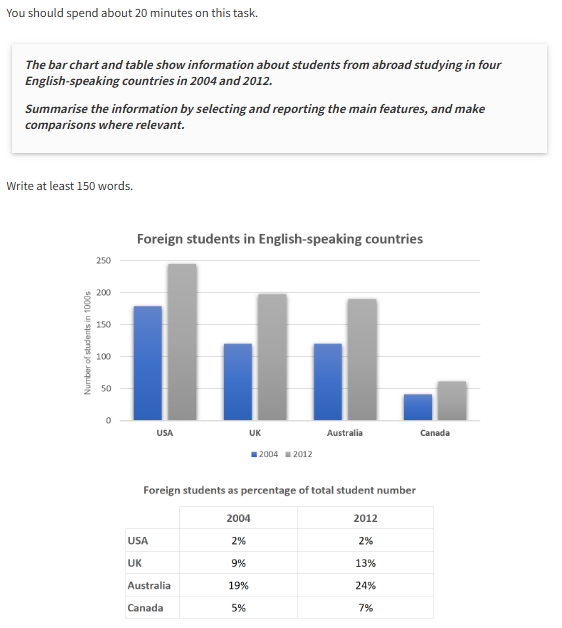
The bar chart shows the number of foreign students studying in four.., while the table show foreign students as a percentage of total student numbers ..
We can see that..
Starting with the number of students, the USA had..
The figures for Australia and the UK were similar, increasing from around...
Canada had a significantly lower number of .., with about..
Next, if we look at the percentage of foreign students, we can see that...
The percentage of foreign students was highest in..
In the USA, the percentage of foreign students remained stabel at..
문제 3.
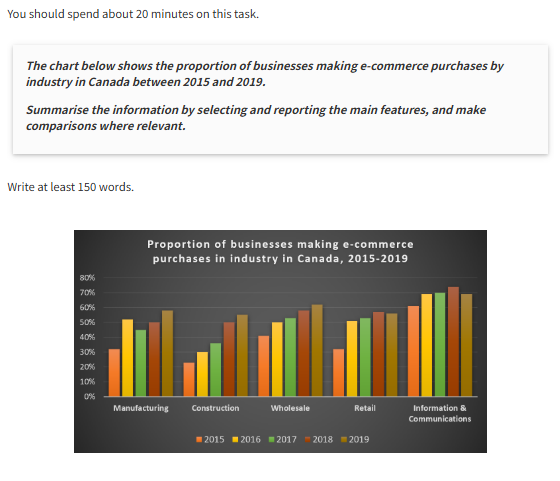
The bar chart provides information about the proportion of businesses purchasing items online according to industry in..
Generally speaking, the proportion of businesses involved in e-commerce..
In this sector, there was a greater proportion of businesses invloved ..
The proportion of businesses invloved in purchases on line in the retail sector followed .., increasing from about ..
Just under 25% of construction businesses used online purchasing in ..., whereas in the wholesale industry the rise was..
As regards manufacturing, there was a near 100% increas in the proportion of ..
tip! 다이어그램에 없는 정보는 적지 마세요. 주어진 데이터에 대한 내용을 혹시 알고 있더라도 배경이유나 자신의 의견을 적는 것은 금물!
문제 4.
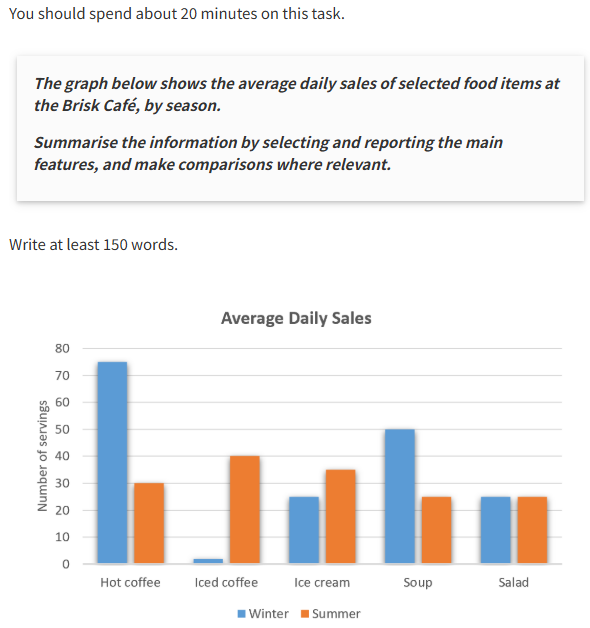
The bar graph shows how many servings of certain food items are sold on ..
Certain food items had much higher sales that..
Hot coffee had the highest number of sales, with ..
Following this, the item with the second highest number of sales was..
The sales numbers for each food item were ..
Iced coffee sales rose significantly, to an average of ..
In general, the aveage daily sales of each food item changed when..
Certain items were ..
tip! 최대한 실수를 피하세요. 복잡한 문장을 쓰려다가 잦은 실수를 하곤 하죠. 시간을 남기고 완성 한 후, 꼭 다시 오타나 문법 등 실수가 없는지 확인해 주세요.
문제 5.
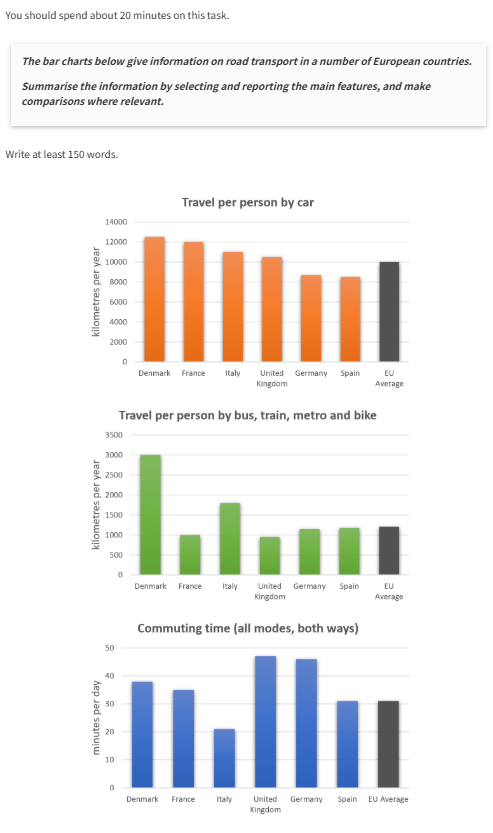
The bar charts give information about.., as well as the average figure for the European Union.
From the information, we can see that..
Perhaps surprisingly, the Danish also make far greater use of .., travelling over..
By comparison, the British and French travel ..
When it comes to commuting times, British drivers spend about ..
'IELTS' 카테고리의 다른 글
| IELTS Writing Task 1 (Academic - Line Graph) (0) | 2025.04.10 |
|---|---|
| IELTS Writing Task 1 (Academic - Table) (2) | 2025.04.09 |
| IELTS Writing Task 2(Academic) 주제 유형 (0) | 2025.04.07 |
| IELTS Writing Task 1(Academic) 문제 유형 (0) | 2025.04.07 |
| IELTS 소개 (0) | 2025.04.07 |